
Good Leaders Are Good at Drawing
4 Boxes, 2 Lines

Robert Kiyosaki sold 44 million copies of Rich Dad Poor Dad. Most people remember the book for “your house is not an asset” and the argument that followed. His company went bankrupt. His seminars got investigated. I’m not here to defend any of that.
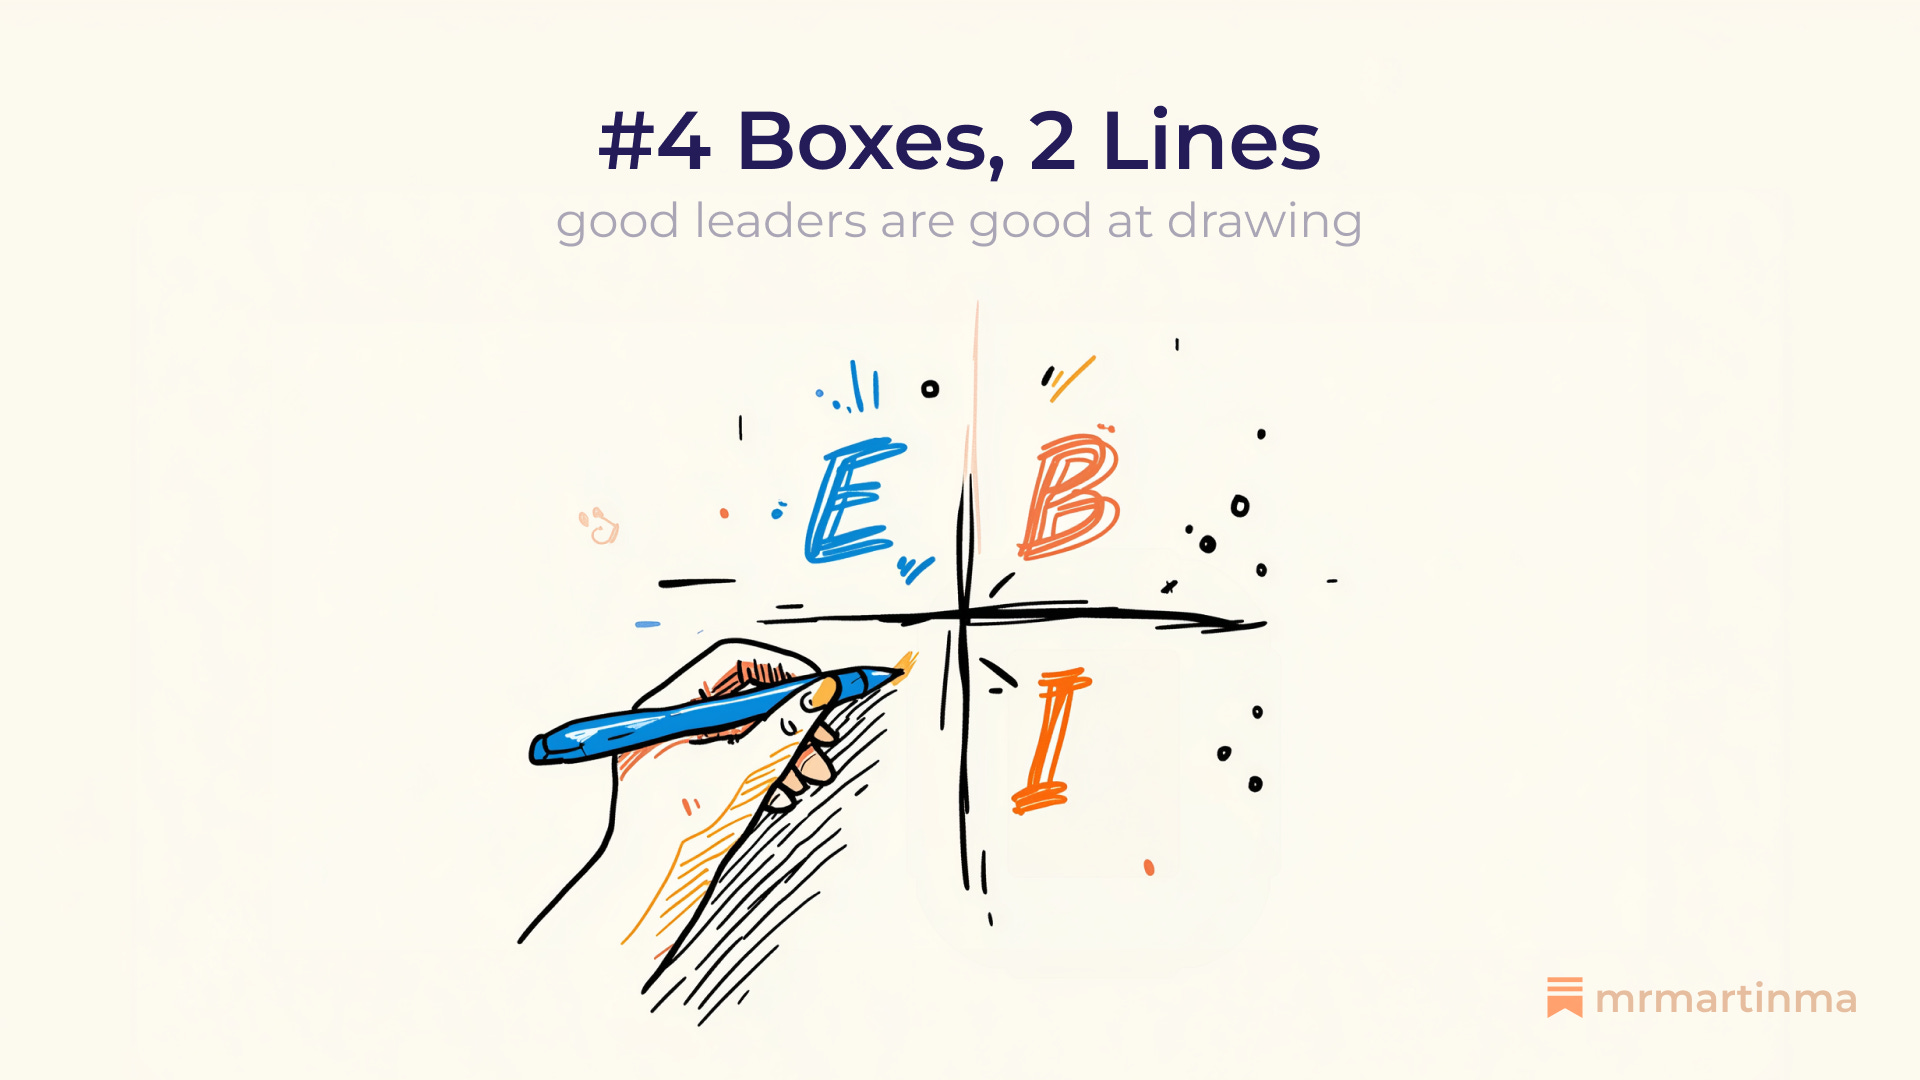
But in the sequel, Cashflow Quadrant, he did something I still think about. He drew a cross on a page. Labeled four boxes. E, S, B, I. Employee. Self-Employed. Business Owner. Investor. And that one drawing explained more about why people get stuck in their careers than most business books manage in 300 pages.
Four boxes. Two lines. A framework millions of people can reproduce from memory.
That drawing changed the way I thought about money. Then it changed the way I thought about my career. And eventually, it changed the way I lead teams. I did somewhat followed Kiyosaki’s financial advice. But, the key is, the act of drawing, of forcing a messy problem into a shape I could see, became the way I understood things.
The best leaders I’ve worked with do this. They pick up a marker and draw the situation before they try to solve it. Quadrants, axes, arrows on a whiteboard. A messy sketch that makes a complex problem simple enough to act on.
The leaders who struggle? They talk. They write decks. They schedule another meeting. But they never pick up the marker.
Why Drawing Works
Now let’s not call it intuition. Dan Roam built an entire thesis around it: any problem can be made clearer with a picture. Bezos sketched Amazon’s flywheel on a napkin in 2001. A loop so simple that every employee could redraw it from memory. It became the strategic anchor for a trillion-dollar company. Collins drew three overlapping circles and called it the Hedgehog Concept. Took companies an average of four years to figure out what goes in those circles, but once they could draw it, alignment followed.
There’s a reason for this. Kahneman and Klein agreed that expert intuition works in environments with regular patterns and adequate practice. Frameworks give you the patterns. Drawing gives you the practice. Lowy and Hood cataloged 56 of these frameworks in a book literally called The Power of the 2x2 Matrix. Four boxes is about the limit of what humans process at a glance. More than that and you’re back to a spreadsheet.
Kiyosaki’s quadrant is one of those 56. And for me, it was the first.
Where It Started
I picked up Rich Dad Poor Dad the way everyone does. Someone recommended it, I read it in a weekend. But the sequel is where things clicked. Kiyosaki drew that cross and suddenly the way I was thinking about cash flow, about my career trajectory, snapped into a shape I could see. Left side of the quadrant. Trading time for money. And seeing it drawn made it impossible to unsee.
I started drawing that quadrant myself. On napkins. In notebooks. The act of drawing forced me to be honest about where I was. Then I started drawing other things. Business model sketches, revenue structures, the cash flow cycle for a side project. Messy, quick, on the back of whatever was nearby. But every time I drew it, the problem got simpler.
Drawing became the way I thought. Not the way I presented — the way I understood.
When I became an engineering manager, the habit came with me. I didn’t consciously decide to “apply visual frameworks to leadership.” I just kept reaching for the marker. A hard conversation? Draw it. A strategy decision with too many variables? Two axes, four boxes, start placing things. The frameworks changed but the instinct was the same one Kiyosaki’s book had wired into me: if you can’t draw the situation, you don’t understand it yet.
Draw the Opportunity
SWOT has been drawn on whiteboards since the 1960s. Four boxes, two minutes, and suddenly the conversation shifts from “what should we do?” to “given these strengths and this threat, what’s our move?” The Ansoff Matrix does the same thing for growth: existing vs. new products across existing vs. new markets. You look at it and immediately see that your growth plan lives in the “new product, new market” box. The highest-risk quadrant. And nobody realized that until someone drew it.
Consulting understood this decades ago. BCG’s Growth-Share Matrix turned portfolio allocation into four animals: stars, cash cows, question marks, dogs. Eighty percent of what a strategy consultant delivers to a client is a drawing with boxes. The drawing forces the conversation that 47 slides couldn’t.
Now - here’s the skill: can you walk into a room where three VPs have been debating a product bet for six weeks, draw a simple impact/effort matrix on the whiteboard, place the options on it, and watch the room align in 15 minutes? The drawing didn’t solve the problem. It made the problem visible. And visible problems get solved. Invisible ones get another meeting.
Draw the Team
The drawings for strategy are well-known. The drawings for people are just as powerful, and most managers don’t use them.
Kim Scott drew Radical Candor as a 2x2: care personally on one axis, challenge directly on the other. That one drawing explains why your nicest manager might be your worst. Ruinous empathy, where you like someone too much to tell them the truth. The Skill/Will matrix gives you a coaching prescription for each direct report in seconds. High skill, low will? They’re not underperforming. They’re bored. That’s a completely different intervention than a performance plan. A 30-second drawing, a completely different outcome.
And then there’s the personal diagnostic. This is where Kiyosaki’s quadrant came back to me. Not for cash flow this time. For management.
Years ago, early in my management career, I was in a skip-level. My manager’s manager asked a question that still sits with me: “How does your team operate?” Simple question. I started answering. Five minutes in, I noticed something. Every sentence started with “I.” I review the PRs. I make the architecture calls. I handle escalations. I onboard new hires. I wasn’t describing a team’s operating model. I was describing me.
That afternoon I went to a whiteboard and drew Kiyosaki’s cross. The same one I’d drawn years ago for cash flow. E, S, B, I. And I landed exactly where I didn’t want to be. S. The self-employed quadrant. The one where Kiyosaki says “the self-employed person doesn’t own a business, the business owns them.” My team couldn’t function without me in the room. I wasn’t leading a system. I was the system. And the day I called in sick, three things stalled because the context lived in my head and nowhere else.
Gerber has a name for this. Working IN the business instead of ON it. Jade Rubick put it sharper: “Competence becomes dependency. Dependency becomes centralization. Centralization becomes a bottleneck.” That was me. The quadrant I’d first drawn about money was now telling me something about my management. I’d bought myself a job.
Can you sketch how your team actually works — how work comes in, how decisions get made, how someone new ramps up — in 60 seconds on a whiteboard? If you can draw it, a system exists outside your head. If the whiteboard stays empty, you ARE the system.
Draw the Trend
The third thing great leaders draw isn’t a framework. It’s a line.
A trend line. Across sprints. Across quarters. Across the morale data you’ve been collecting in 1:1s that you haven’t connected yet.
Most managers react to individual data points. “We had a rough sprint.” Leaders who draw? They sketch the last six months and see the pattern: we’ve been declining since September, and the floor is about to give way.
Traders do this every day. Support levels: the baseline performance a team doesn’t drop below. Resistance levels: the ceiling they keep hitting. False breakouts: the post-offsite energy that fades in two weeks. You don’t need a Bloomberg terminal. You need a whiteboard and the willingness to draw the line across six months of data instead of reacting to the last two weeks.
Klein’s research explains why this works. He studied fire commanders, military leaders, ICU nurses. They don’t compare options analytically. They recognize patterns from experience and act. The trend line is how you build that pattern library. You can’t recognize a pattern you’ve never drawn.
I’ve always loved running operational WBRs for exactly this reason. Weekly business reviews where you put the numbers on the wall and stare at them together. Not to celebrate or panic. To see the shape. Week over week, the line tells you things that no single data point can. A metric that’s been quietly sliding for eight weeks doesn’t show up in a status update. It shows up when you draw the line.
The Full Circle
Every framework in this post is a drawing. Four boxes. Two axes. A line across data points. None of them require artistic talent. They require the willingness to pick up a marker, look at a messy situation, and reduce it to something a room full of people can see at the same time.
I started drawing because a personal finance book told me to put myself in a quadrant. That habit followed me into management, into strategy, into the way I read my teams. The frameworks changed. The instinct didn’t.
Think about the last time you were stuck on a hard decision. A team problem, a strategy bet, a resource trade-off. Did you talk about it? Write about it? Schedule a meeting about it?
Or did you draw it?
So here is my question to you: when was the last time you picked up a marker — and what did the drawing show you that the conversation couldn’t?
#Leadership #EngineeringManagement #RichDadPoorDad #Strategy #Management